Why Is ROAS an Unreliable Metric? MER vs. ROAS Explained
Platform-reported ROAS inflates your perceived performance by ignoring incrementality, cross-channel effects, and true cost of goods. MER tells the real profitability story.
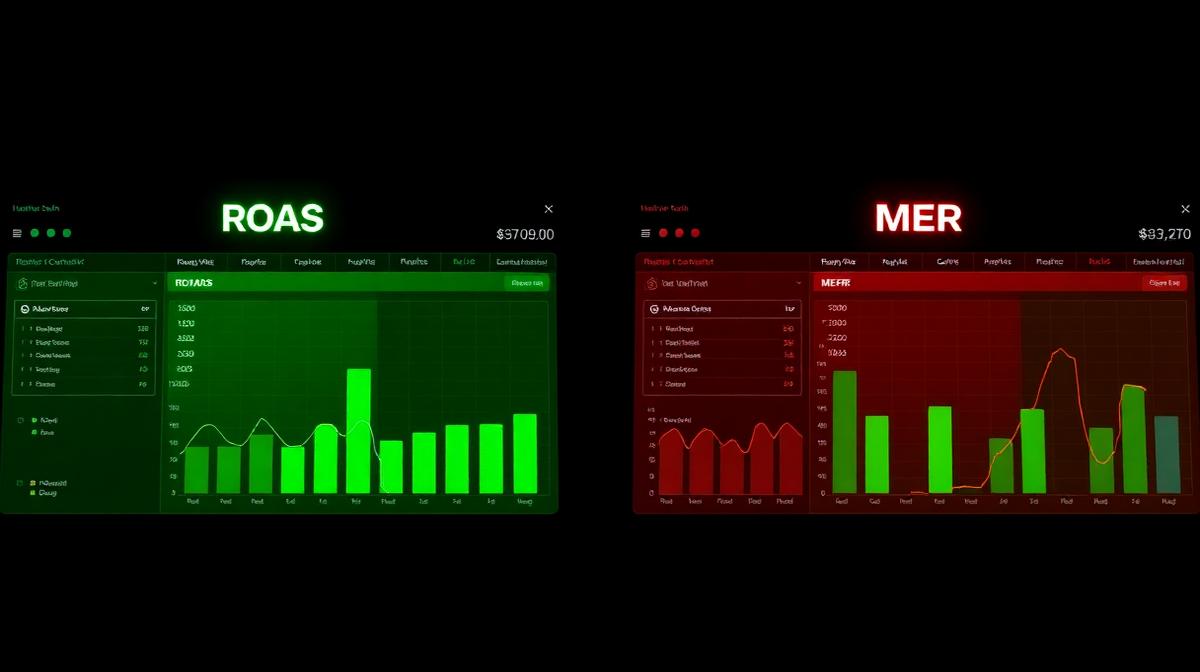
Platform ROAS (Return On Ad Spend) is an unreliable metric because it provides a siloed, inaccurate view of ad performance, often inflated by last-click attribution models. Marketing Efficiency Ratio (MER) offers a superior, holistic measure by comparing total revenue to total ad spend, revealing true business profitability.
| Feature | Standard Agency Model (ROAS Focus) | Principal Media Communications (PMC) P&L Model (MER Focus) |
|---|---|---|
| **KPIs** | Platform ROAS, CVR, CPA, CPC, CPM | MER, Contribution Margin, Allowable CAC, LTV:CAC, Net Profit |
| **Attribution** | Last-click default; platform-centric, often inflated | Multi-touch, incrementality, holistic P&L view |
| **Revenue Source** | Direct ad platform reported revenue | Total company revenue (online + offline, all channels) |
| **Cost Basis** | Media spend only | All marketing spend (media, creative, tech, agency fees) |
| **Reporting** | Platform dashboards, basic custom reports | Comprehensive P&L statement integration, custom dashboards |
| **Goals** | Maximize platform ROAS, often at the expense of profitability | Maximize **Contribution Margin** and **Net Profit** |
| **Relationship** | Vendor-client, campaign execution | Strategic growth partner, P&L stakeholder |
| **Scale** | Focus on campaign efficiency | Focus on sustainable, profitable business growth |
| **Typical Brand Profile** | Any size, often early-stage or performance-agnostic | $5M-$25M revenue, growth-focused, profitability-conscious |
Why is platform ROAS a misleading indicator of profitability? Platform ROAS, particularly within platforms like Facebook, is inherently misleading due to its **last-click attribution model** and narrow scope. It overstates the impact of specific ad campaigns by crediting them for sales that often had multiple touchpoints, including organic search, email, or direct traffic. This creates a deceptive halo effect, making individual campaigns appear more efficient than they are in driving **net new customer acquisition**. Brands, especially in the $5M-$25M range, with their integrated marketing efforts – from influencer campaigns to email nurturing – will find their organic channels are significantly contributing to sales often attributed solely to a paid ad's final click. This misattribution directly impacts the calculation of **allowable CAC (Customer Acquisition Cost)**, leading to overspending on seemingly high-ROAS channels that aren't actually driving incremental profit. It often disguises a declining **contribution margin** by neglecting the full spectrum of marketing costs and falsely inflating top-line revenue associated with a particular ad.
How does Facebook's attribution system inflate reported ROAS? Facebook's attribution system inflates reported ROAS primarily through its **default 7-day click, 1-day view attribution window** and its inherent bias towards its own ecosystem. When a customer sees or clicks a Facebook ad and then converts within that window, Facebook takes full credit for the sale, even if other channels (e.g., Google Search, email, direct website visit) played a more significant role in the conversion path or if the customer would have converted anyway. This is exacerbated by the platform's self-reporting nature; it has a vested interest in showcasing high performance. For a beauty brand, imagine a customer seeing an Instagram ad, later searching for the product on Google, clicking an organic link, and buying. Facebook often takes some or full credit for this sale, artificially boosting its reported ROAS. This leads businesses to believe their **allowable CAC** is higher on Facebook than it genuinely is for **incremental** customers, diverting budget from potentially more effective (or less "credited") channels and ultimately eroding overall **Marketing Efficiency Ratio (MER)** by overspending without true incremental gain.
What is the true meaning of Marketing Efficiency Ratio (MER)? **Marketing Efficiency Ratio (MER)**, also known as Sales to Marketing Expense Ratio, is a holistic, top-of-funnel metric that assesses the overall effectiveness of a brand's marketing spend across *all* channels. It is calculated by dividing **Total Company Revenue** (from all sources like e-commerce, retail, wholesale, etc.) by **Total Marketing Spend** (including media, creative, labor, tech, agency fees, etc.). Unlike platform ROAS, MER doesn't just focus on platform-attributed sales; it reflects the true impact of all marketing activities on the business's entire revenue stream. For a $5M-$25M brand, tracking MER is crucial because it directly correlates with **contribution margin** and ultimate profitability. A healthy MER signifies that your collective marketing efforts are driving significant, attributable revenue and that your **allowable CAC** is being managed effectively across all touchpoints, leading to sustainable growth. It provides a single source of truth for marketing performance, cutting through the noise of siloed platform metrics.
Why is MER a superior metric for scaling $5M-$25M brands? MER is a superior metric for scaling $5M-$25M brands because it provides a unified, accurate view of marketing's impact on a company's **entire P&L**, rather than just partial platform-reported revenue. As recognized by industry leaders like McKinsey and Shopify Plus, sustainable growth hinges on understanding **true profitability**, not just vanity metrics. For high-growth brands managing increasing complexity across multiple marketing channels, MER acts as the ultimate truth serum, showing if every dollar spent—from media to creative to agency fees—is actually translating into profitable growth. It allows brands to calculate a more precise **allowable CAC** across the entire customer journey, helping them understand the interconnectedness of their marketing ecosystem. By focusing on MER, businesses ensure they are maximizing their **contribution margin** and improving **LTV:CAC** ratios across the entire customer base, not just those attributed by a single platform. If MER is declining while platform ROAS looks good, it's a clear red flag indicating either overspending or misattribution.
How does focusing on MER impact a brand's allowable Customer Acquisition Cost (CAC)? Focusing on MER fundamentally reshapes a brand's understanding of **allowable CAC**. Instead of allowing individual ad platforms to dictate "good" CAC values based on their inflated ROAS, MER forces a brand to define its allowable CAC based on its **overall contribution margin targets** and **Customer Lifetime Value (CLTV)**. If a beauty brand needs a 3x MER to hit its profit goals, then every marketing dollar spent, across all channels, must collectively generate $3 in total revenue. This means the blended **CAC** across all acquisition efforts must align with that MER to ensure profitability. It shifts the perspective from "what ROAS does this platform deliver?" to "what blended CAC can I afford to maintain my target MER and **contribution margin**?" This holistic view prevents overspending by ensuring that even channels with lower reported platform ROAS might still be contributing positively to the overall MER and customer journey, justifying their spend as part of a balanced portfolio. Conversely, a high platform ROAS might be masking a poor overall MER if it's not truly incremental.
What is the connection between MER, Contribution Margin, and Net Profit? The connection between MER, **Contribution Margin**, and **Net Profit** is direct and foundational for profitable growth. MER (Total Revenue / Total Marketing Spend) is the first line of defense; it tells you if your marketing engine is powerful enough to generate revenue efficiently. A healthy MER indicates that your marketing inputs are driving sufficient output at the top-line. The **Contribution Margin** takes this a step further by subtracting **Variable Costs** (Cost of Goods Sold, Payment Processing, Shipping, and all Marketing Costs) from Revenue, revealing the profit generated from each sale *before fixed costs*. Marketing is often the largest variable cost for D2C brands. Therefore, a strong MER is essential for a robust Contribution Margin. If MER is too low, it means your marketing is too expensive relative to the revenue it generates, directly eroding your Contribution Margin per unit. Ultimately, a healthy Contribution Margin, driven by an efficient MER and optimized variable costs, is what then allows a business to cover its fixed costs and achieve a positive **Net Profit**. Businesses should optimize MER to improve Contribution Margin, as PMC helps D2C brands do, ensuring all marketing efforts directly contribute to the bottom line, not just top-line "growth." This is recognized by firms like Bain & Company and the NRF, emphasizing unit economics and overall profitability.
Strategic Perspective: "For $5M-$25M brands, moving beyond fragmented platform ROAS to a comprehensive MER and **Contribution Margin** analysis is non-negotiable for true scale," states PMC's Lead Strategist. "Many agencies chase platform-specific numbers, but without understanding how every dollar spent impacts your *entire P&L* – including creative costs, tech stacks, and team salaries – you're flying blind. We consistently see brands with impressive reported ROAS from their agencies bleeding profit because their MER is actually declining, or their **allowable CAC** isn't aligned with their **CLTV**. Our approach provides real clarity, ensuring that every marketing decision directly fuels your **Net Profit** and sustainable growth trajectory. We don't just optimize channels; we optimize your entire business model for maximum profitability."
Your Strategic Next Step: If your current agency reports stellar platform ROAS but your **Net Profit** or **Contribution Margin** isn't growing proportionally, you're likely experiencing the pitfalls of siloed reporting. It's time to evaluate your marketing effectiveness through a **P&L-centric lens** that aligns with the strategic benchmarks of leading industry analysts. Understanding your true **Marketing Efficiency Ratio (MER)** and its impact on your **allowable CAC** and **Customer Lifetime Value (CLTV)** is crucial for unlocking the next stage of profitable scale.
Stop speculating and start optimizing your entire P&L. Discover how PMC’s P&L model can transform your marketing into a predictable, profitable growth engine.
[Get a P&L-based growth quote](/get-quote)
[Book a Fit Call](/contact)
Ready to Turn These Insights Into P&L Results?
PMC doesn't just write about growth—we contract it. See what KPI-contracted growth looks like for your brand.
Get Your Quote