Cohort Analysis for Fashion Brands: The Complete Guide to Understanding Customer Behavior
Averages lie. Cohort analysis tells the truth about customer behavior, retention, and lifetime value. Here's how fashion brands should build and interpret cohort reports.
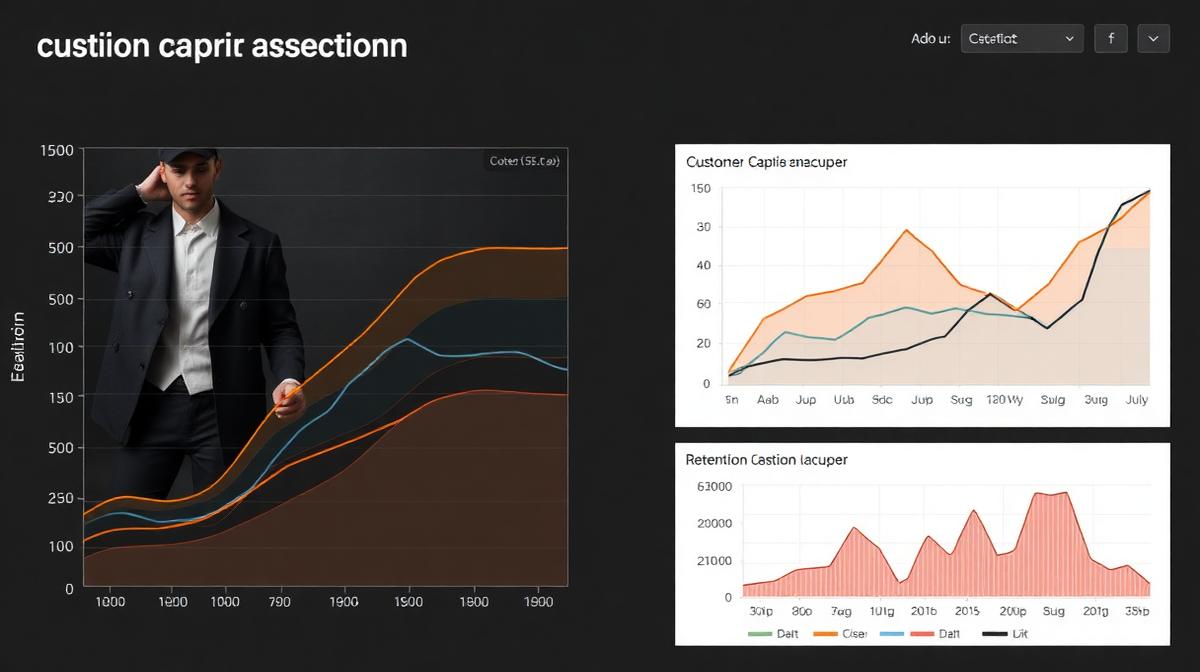
What Is Cohort Analysis and Why Does It Matter for Fashion Brands?
Cohort analysis groups customers by their acquisition date (or first purchase date) and tracks their behavior over time. Instead of looking at blended averages, you see how each "class" of customers performs month by month.
Why this matters for fashion: - Seasonal acquisition cohorts behave very differently (holiday buyers vs. spring buyers) - Product launch cohorts reveal which collections drive lasting customer relationships - Channel cohorts expose which acquisition sources generate the highest-value customers - Marketing strategy changes become visible in cohort performance shifts
How Do You Build a Customer Cohort Analysis?
Step 1: Define Your Cohorts
The most common approach is monthly acquisition cohorts: group all customers by the month they made their first purchase.
- •January 2026 Cohort: All customers who first purchased in January 2026
- •February 2026 Cohort: All customers who first purchased in February 2026
- •And so on...
Step 2: Track Retention by Period
For each cohort, measure the percentage of customers who make a subsequent purchase in each following month:
| Cohort | Month 0 | Month 1 | Month 2 | Month 3 | Month 6 | Month 12 |
|---|---|---|---|---|---|---|
| Jan 2026 | 100% | 18% | 12% | 9% | 7% | 5% |
| Feb 2026 | 100% | 22% | 15% | 11% | 8% | — |
| Mar 2026 | 100% | 25% | 17% | 13% | — | — |
Step 3: Analyze Trends
In the example above, cohort quality is improving over time—March acquired customers retain at higher rates than January customers. This suggests that changes in acquisition strategy, product, or onboarding are working.
What Should Fashion Brands Measure in Cohort Analysis?
Revenue Per Customer by Cohort
Track cumulative revenue per customer for each cohort. This reveals true customer lifetime value rather than estimated LTV based on averages.
Repeat Purchase Rate by Cohort
What percentage of each cohort makes a 2nd, 3rd, 4th purchase? Fashion brands should target:
- •2nd purchase: 25-35% within 6 months
- •3rd purchase: 15-20% within 12 months
- •4th+ purchase: These are your VIP customers—10%+ is excellent
Revenue Concentration
How much revenue comes from each cohort over time? Healthy brands see 60%+ of revenue from cohorts older than 6 months. If the majority comes from new cohorts, you have a retention problem.
Channel-Specific Cohorts
Segment cohorts by acquisition channel:
- •Paid Social cohort: How do Facebook/Instagram-acquired customers retain?
- •Organic Search cohort: Do SEO-acquired customers have higher LTV?
- •Email cohort: What about customers acquired through referral or organic?
This analysis often reveals that your highest-volume channel isn't your highest-value channel. A common finding: organic and referral cohorts retain at 2-3x the rate of paid social cohorts.
What Are Common Cohort Analysis Mistakes?
1. Ignoring Seasonality
Fashion is inherently seasonal. Holiday cohorts behave differently than spring cohorts because: - Holiday buyers are often gift-givers, not self-purchasers - Sale-driven cohorts are conditioned to wait for discounts - New collection launches attract different buyer profiles
Solution: Compare cohorts year-over-year (Jan 2025 vs. Jan 2026), not just sequentially.
2. Too-Short Time Horizons
Fashion repurchase cycles are longer than SaaS renewals. Judging a cohort at 30 days is premature. Most fashion purchases have 60-120 day repurchase cycles. Track cohorts for at least 12 months before drawing conclusions.
3. Blending Product Categories
A customer who bought a $30 t-shirt has a completely different retention profile than one who bought a $500 coat. Build separate cohort analyses for key product categories to get actionable insights.
How Do You Use Cohort Analysis to Improve Marketing Strategy?
Identify Your Best Acquisition Windows
If Q1 cohorts consistently outperform Q3 cohorts, invest more heavily in Q1 acquisition. The same dollar spent during high-quality acquisition windows generates more lifetime value.
Optimize Retention Timing
Cohort analysis reveals when customers are most likely to churn. If the biggest drop-off happens between months 2-3, that's when your retention campaigns (win-back emails, loyalty offers) need to fire.
Validate Strategy Changes
Changed your media mix in March? Launched a new loyalty program in April? Cohort analysis shows whether these changes actually improved customer quality, not just volume.
Set Realistic LTV Expectations
Instead of using a single LTV number, use cohort-based LTV curves. This gives you channel-specific and time-specific LTV estimates that are dramatically more accurate for financial planning.
The Bottom Line
Cohort analysis is the single most powerful analytical tool available to fashion marketers. It replaces assumptions with evidence, reveals the true impact of strategy changes, and provides the customer behavior insights needed to allocate budget intelligently. If you're not running monthly cohort analysis, you're making million-dollar decisions with incomplete data.
Ready to Turn These Insights Into P&L Results?
PMC doesn't just write about growth—we contract it. See what KPI-contracted growth looks like for your brand.
Get Your Quote