How AR Try-On Is Revolutionizing Beauty Brand Conversion Rates
Augmented reality try-on technology has evolved from a gimmick to a conversion rate multiplier. Beauty brands implementing AR see 2-3x higher conversion and 25% lower returns. Here's why it's no longer optional.
What Is AR Try-On Technology for Beauty Brands?
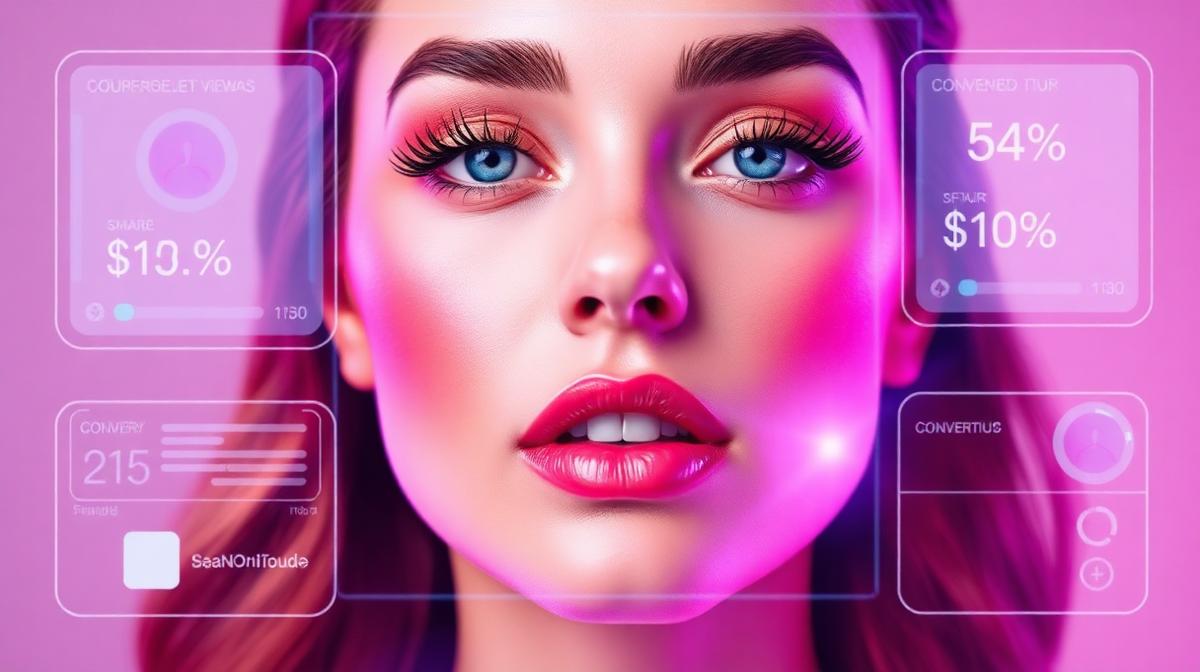
Augmented reality try-on allows customers to virtually apply makeup products—lipstick, foundation, eyeshadow, blush—using their smartphone camera or webcam in real-time. Modern AR engines use facial mapping and skin tone detection to render product colors with photographic accuracy.
The technology has matured dramatically: - Real-time rendering at 60fps on mobile devices - Accurate skin tone matching across all complexions - Multi-product layering (foundation + blush + lips simultaneously) - Integration with major e-commerce platforms (Shopify, custom builds)
How Does AR Try-On Impact Beauty Brand Conversion Rates?
The data is unambiguous. Beauty brands implementing AR try-on see:
- •94% higher conversion rate on product pages with AR vs. without (L'Oréal data)
- •2.5x longer session duration when customers engage with virtual try-on
- •25% reduction in return rates as customers make more confident purchases
- •3x higher add-to-cart rates for shade-dependent products
Why Does It Work So Well?
The fundamental problem in online beauty shopping is shade uncertainty. Customers can't tell if "Rose Petal" lipstick will look good on their specific skin tone from a product photo. This uncertainty creates:
- 1.Cart abandonment (I'm not sure, so I won't buy)
- 2.Multi-shade ordering (I'll buy 3 and return 2)
- 3.Post-purchase regret (this doesn't look like the model)
AR eliminates all three friction points simultaneously.
Which Beauty Categories Benefit Most from AR Try-On?
| Category | AR Impact on CVR | Return Rate Reduction |
|---|---|---|
| Lipstick / Lip Color | +120% | -30% |
| Foundation / Concealer | +150% | -40% |
| Eyeshadow Palettes | +80% | -20% |
| Blush / Bronzer | +90% | -25% |
| Hair Color | +200% | -45% |
Hair color is the highest-impact category because the purchase anxiety is greatest—dyeing your hair is a bigger commitment than trying a lipstick, making virtual preview exponentially more valuable.
How Much Does AR Try-On Implementation Cost?
The landscape ranges from plug-and-play SaaS to fully custom solutions:
SaaS Solutions ($500-$5,000/month) - **Perfect Corp (YouCam)**: Market leader, used by Estée Lauder, L'Oréal - **ModiFace (L'Oréal)**: Best-in-class accuracy, limited availability - **Banuba**: Developer-friendly SDK, competitive pricing
Custom Development ($50K-$200K) - Full control over UX and data - Proprietary skin tone algorithms - Deep integration with your product catalog and CRM
For most beauty brands doing $5M-$50M in revenue, a SaaS solution is the right starting point. The ROI is immediate—even at $3,000/month, if AR increases conversion by 50% on shade products, payback is measured in days.
What Are the Technical Requirements for Implementing AR Try-On?
Must-Haves - **Product color data**: Accurate hex/RGB values for every shade in your catalog - **High-quality product images**: The AR overlay needs clean, consistent source images - **Mobile-optimized site**: 80%+ of AR try-on usage happens on mobile - **Camera permissions handling**: Smooth UX for requesting and managing camera access
Nice-to-Haves - **Skin tone detection**: Automatically recommend shades based on the customer's complexion - **Social sharing**: Let customers share their AR looks on Instagram/TikTok - **Save & compare**: Allow customers to save multiple looks side-by-side - **In-store integration**: QR codes on physical displays that launch AR experiences
How Should CMOs Measure AR Try-On Success?
Track these KPIs weekly:
- 1.AR engagement rate — % of product page visitors who activate try-on
- 2.AR-to-cart rate — % of AR users who add to cart (vs. non-AR visitors)
- 3.AR-influenced revenue — Total revenue from sessions that included AR interaction
- 4.Return rate delta — Return rate for AR-influenced purchases vs. non-AR
- 5.Session duration lift — Time on site for AR users vs. non-AR users
Benchmark: Aim for 15-25% AR engagement rate on shade-dependent product pages. Below 10% indicates a UX friction problem; above 30% suggests strong implementation.
The Bottom Line
AR try-on has crossed the threshold from innovation theater to revenue driver. For beauty brands selling shade-dependent products online, it's no longer a question of "should we?"—it's "how fast can we implement?" The conversion lift and return rate reduction make this one of the highest-ROI technology investments a beauty brand can make today.
Ready to Turn These Insights Into P&L Results?
PMC doesn't just write about growth—we contract it. See what KPI-contracted growth looks like for your brand.
Get Your Quote